Swing Trading U.S. Equity Indexes

Latest

Almost There?

Here’s the local map:

2013_03_20 SPX 60min

It finally looks like we are nearing the completion of this move. If this is correct, we should now be in yellow subwave 5 within red wave 5. For targets, one thing that often happens is that wave 1 is the same length as wave 5 (wave 3 is usually the longest, often 127% or 161% of wave 1). Since we are now working on both red wave 5 and yellow wave 5, we can get proportionality projections (called measured moves) from both of them. 100% of red wave 1 measures to 1589, and 100% of yellow wave 1 measures to 1574. The Dow waves count the same, but have slightly different lengths, so the target range is a little tighter: 14678 to 14746. Of course, there’s no requirement that we get a top in this area, but the market does like to have proportionality and prettiness.

If we do get a top in this area, what then? Well, what we would be looking at correcting is the move from the November lows (S&P 1343, Dow 12471) to the highs. A nice-sized correction would last 2-3 months and take us under 1500. 1465 should be supportive, so any pushes under that level should be reversed very quickly. First things first, though, let’s see if we top out where I expect.

My best read on the longer-term situation is pretty bullish, as it looks to me like we’re getting an extended 5th wave within an extended 3rd wave. (An extended wave is one that is disproportionately large relative to the other waves, with the subwaves of the extended wave actually being more proportional to the other primary waves.) Here is my best-guess count of the big picture:

2013_03_20 S&P Daily


This doesn’t follow formal Elliott Wave numbering conventions, but hopefully you get the point. The light purple numbers represent the first two waves of the light blue extended wave 3. The green 1-2-3 are part of extended yellow wave v. If correct, this numbering is long-term very bullish. The coming correction is only for that green wave 3 (the move from the November lows), so not that much in the grand scheme of things. After the green wave 5 higher completes, on the other hand, then we have finished the green waves, the yellow waves, and red wave 3, which is a bigger deal. Again, this is looking pretty far ahead and is pretty speculative, so it doesn’t make much sense to think about it too hard right now.

I hope this makes sense. I might have other things to say, but I’m sleepy and ready for bed.
Looking Good

Last time I said I leaned toward the bullish scenario and would look to enter near 1500 with a stop under 1495. It sold off down to 1501.48 and basically went straight up 40 points from there. Here’s an update on the wave count:

2013_03_6 SPX 60min

And here’s a localized look at just the red wave 5 that is underway right now (this is a 15min chart of the SPY):

2013_03_6 SPY 15min

This suggests we have another small push higher to finish the yellow 3, then there’s still the yellow 4 down and 5 up before things will start to look complete on this advance. Of course, things often don’t play out as neatly as this, but I think it’s helpful to have a potential roadmap.

Based on the idea of proportionality between red waves 1 and 5, wave 5 should get to at least 1550 and the prettiest symmetry would be 1589. Once this tops, then I will expect a correction of the entire move off the 1343 November lows.

Taking another step back, there is the issue that we have 7 waves up off the October 2011 lows at 1074. Normally an impulse move is either 5 waves or 9 waves, but not 7, so I’ll be looking for yet another larger wave up when that time comes. This all assumes that the same mapping is in play, of course; what’s happening with the bigger picture is not particularly clear to me right now. Here’s that bigger picture since the 2011 lows:

2013_03_6 S&P DailyA note: One of you complained to me once that the numbering is very small in the charts. I don’t know what the email alerts look like, but if you go directly to the blog and click on the charts, a big version will pop up.


AAPL

AAPL isn’t showing any bottoming pattern yet, but longer term I think the chart looks good for a big bottom anywhere in the 390-424 range. (424 right now)

Two Options

Well, it bounced hard off that nice ABC corrective pattern and zoomed right back to the highs. The Dow set a new high, but the S&P did not. That correction down to S&P 1485 was very quick, and a little shallower than I would have liked. This suggests one of two options to me:

(1) The market is very bullish and wants no part of going lower. Red wave 5 up has begun and its proportionality target is the S&P 1550-1590 range (the all-time high is 1576).

(2) The red wave 4 down is not over yet. This is the “X” part of an ABC-X-ABC double move that will give wave 4 a little more heft. Target remains the 1450-1480 area.

I lean toward option 1 being correct, but I don’t feel strongly about that. I was lucky to catch a swing from 1487 to 1524 (nearly the whole move, but just a partial position size as I was scaling in), but have exited it now. If we chop down toward 1500 again I may reenter, perhaps with a stop under 1495ish.

The sequester adds some uncertainty to all this, as it’s not a huge real negative, but can’t help but put a damper on positive sentiment. Some sort of can-kicking, however, could give the market another little nudge higher.

A Pullback to Buy?

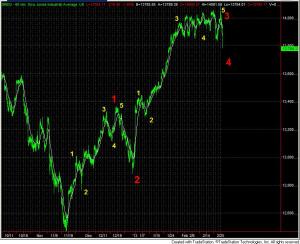
Wave 5 didn’t go as high as I was expecting on the Dow, but so far this wave count is still my path-of-least resistance plan for the market:

2013_02_25 Dow 60min

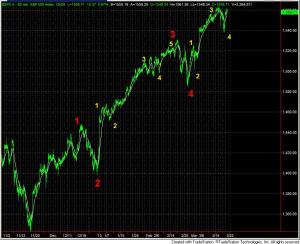
The corresponding wave count on the S&P 500 looks a bit nicer, as yellow wave 5 wasn’t so truncated:

2013_02_25 SPX 60min

If things play out to form, we should now be in the red wave 4 correction, with a wave 5 push to at least nominal new highs still to come. That’s a decently proportional ABC down on the S&P chart, so it’s not impossible that today’s close will be the extent of the correction, but the chart would look nicer if it went a bit deeper (the best low would be somewhere in the the 1460 to 1480 area, imo). If there is any push under 1450, my expectation is that it will be quickly rejected (if not, then I would have to reassess what is going on).

In short, to me the pattern suggests that this is a pullback to buy. Of course, there’s no metaphysical requirement that the pattern complete properly. Market valuation is reasonably supportive of the S&P in the low 1500s, but I think newsflow is more likely to be a drag than a help (especially the impact of austerity, in particular the payroll tax hike). I don’t really see the argument for new highs right now, but hell, we were there just this morning in the Dow and almost in the S&P.

I upped my long-only 403(b) account to 25% long on the close today. I will up that to 50% if we get a little more weakness (and maybe 75% if we get under 1460).

Wave Count Map

Last week the S&P consolidated just under the 1524 fibonacci extension target from the last pullback. Reaching a target is not the same as hitting resistance, though. Today it broke out of the recent range and started pushing higher. There are just no sellers on this tape, and there are no indications that it’s time to short (momentum has decreased, but that doesn’t mean it can’t keep grinding higher).

The wave patterns are often useful for suggesting target areas where an impulsive move might end. Here’s a wave count on the Dow since the pre-Thanksgiving lows:

2013_02_19 Dow 60min

I did not expect the yellow wave 4 correction to be as shallow as the yellow wave 2, but as I said there just aren’t any sellers.  As long as today’s breakout doesn’t fail, the yellow wave 5 projects to at least Dow 14,199 and probably not more than 14,400.  Interestingly, the all time high on the Dow from 2007 is 14,198, so it makes sense for that to be a target (only 165 points away now). A push into this area should complete the yellow wave 5 and red wave 3. The red wave 4 pullback would most likely be of a similar scale to the 482-point wave 2 pullback. Then there would be a wave 5 up to at least minor new highs (possibly a false breakout and failure, but there will be plenty of time to plan for that if things actually follow this map).

I still believe the tax increases and whatever cuts come out of the sequestration will have some bite that the market is not planning for.  The scenario above suggests more upside thrusts, but the net movement doesn’t have to be all that many points, as the end of wave 3 shouldn’t be too far away, and wave 5 up doesn’t need to be much larger than wave 4 down.

Until the Dow tests those highs, I will still avoid intermediate market swing trades on either side. It’s too extended to buy, and too strong to short. I’m daytrading the futures and playing some quick swings on individual stocks. My slow long-only 403(b) is unfortunately languishing on the sidelines since the third week of January or so.

Almost to SPX 1524

As I type this, the S&P is at 1521, very close to the 1524 target that I’ve mentioned several times.  I’m still not shorting, since I’m nervous about a continued slow grind higher, but I do expect to see 1500 again before 1550.  If I had to make a projection, something like this would make sense to me (with more wiggles and maybe a head and shoulders top):

2013_02_12 S&P Daily

1450 to 1470 is a decent support area.

I still don’t see compelling reasons to be aggressive on either side, though.  The U.S. gov’t austerity should lop about 2% off of GDP growth this year, which should drag on earnings.  2013 S&P 500 earnings are currently estimated to be in the $107 to $110 range.  The austerity, combined with the tendency for analysts to be excessively optimistic several quarters out (see the cool graph below), suggest to me that we’re more likely to come in around $105 or a little lower.  Even given that lower estimate, though, having the S&P in the low 1500s is not unreasonable.  In my opinion, however, it does suggest that a sustained move down into the upper 1400s is more likely than a sustained move up into the upper 1500s.

2013 earnings vs 2009

Review of Stock Picks

Last March and April I threw out a few stock picks.  These fell into three categories: big safe dividend payers, small very-high dividend payers, and small value-growth stocks.  Here are the results:

BIG SAFE STOCKS

INTC: price at selection 27.99, target 32; now 21.03, return = -25%

AAPL: price at selection 607, target 700; target hit, return = +15% (now 479.93)

CAT: price at selection 103.25, target 120; now 96.6, return = -6.4%

JPM: price at selection 43.72, target 50; now 48.66, return = +11%

GE: price at selection 19.45, target 21; target hit, return = +8% (now 22.45)

HIGH-DIVIDEND MLPs (managed limited partnerships) — returns don’t include ave 10% dividends

MPW: price at selection 8.87; now 13.66, return = +54%

BKCC: price at selection 9.36; now 10.59, return = +13%

NCT: price at selection 6.86; now 10.75, return = +57%

HTGC: price at selection 11.12; now 12.29, return = +11%

GROWTH STOCKS

VELT: price at selection 12.49; now 4.04; return = -68%

STX: price at selection 27.93; target 35 hit; return = +25% (now 35.05)

FSII: price at selection 4.98; bought out for 6.20; return = +24%

SCLN: price at selection 6.21; target 7 hit; return = +13% (now 4.90)

Over this time, the S&P has gone from roughly 1380 to 1517, or +10%.  The average return of my selections (not including dividends) was … 10%!  Exactly market average!  Not the most impressive display ever.  This is why I favor day trading and market timing over investing.  After I missed the bull move at the start of last year, my market timing has been quite good since then (if only I traded with more conviction).  In sum, don’t expect more individual stock picks from me anytime soon.

Waiting

I’m not seeing any reason to enter swing trades on either side right now.  If the Republicans do indeed pass a mini raise of the debt ceiling (pushing the default date back to May or so), that removes the main catalyst for near-term weakness, IMO.  Valuations are getting less attractive than they have been the last couple years, so I’m not expecting upside above the low 1500s (S&P) unless there is some surprising economic strength.  The tax hikes in the fiscal cliff deal and the spending cuts (hopefully) in the coming deal should provide a meaningful drag on economic growth this year, which in turn should cap both top- and bottom-line corporate results.

Short-term, we’re pretty extended on the upside and could use some consolidation, but S&P 1500 and 1524 or so remain targets above.

Stalled

The last 5 closes for the S&P 500 are 1472, 1472, 1471, 1472, and 1473.  Wow.  The high prices those days have all been between 1472.05 and 1473.96.  I exited my short after the close today at breakeven.  I can’t tell if this is consolidation (before the next leg up) or stalling/topping at the important 1474 level, but I decided to wait to reshort either after slightly higher prices than this, or after it shows actual weakness.